Modeling resilience to climate change
- Published
- 6 min reading

There is no doubt that extreme weather events are becoming intense. At the same time, the connection between the insurance industry and climate change is tightening. With unusual natural phenomena, the insurance risk increases, and so does the risk in the profitability of insurers themselves. That is why it is so important to keep our fingers on the pulse.
A solution by McKinsey & Company
In the article “How to increase grid resilience through targeted investments”, McKinsey & Company discuss the topic of modeling resilience to climate change in the context of the impact of extreme weather events on electrical networks. A five-step methodology is presented to help manufacturers, network operators, utilities and regulators ensure the uninterrupted supply of electricity.
Research shows that modeling climate change risk and resilience can provide invaluable information for making the right business decisions. The presented methodology has many universal elements that can also be used in weather risk management in the insurance industry.
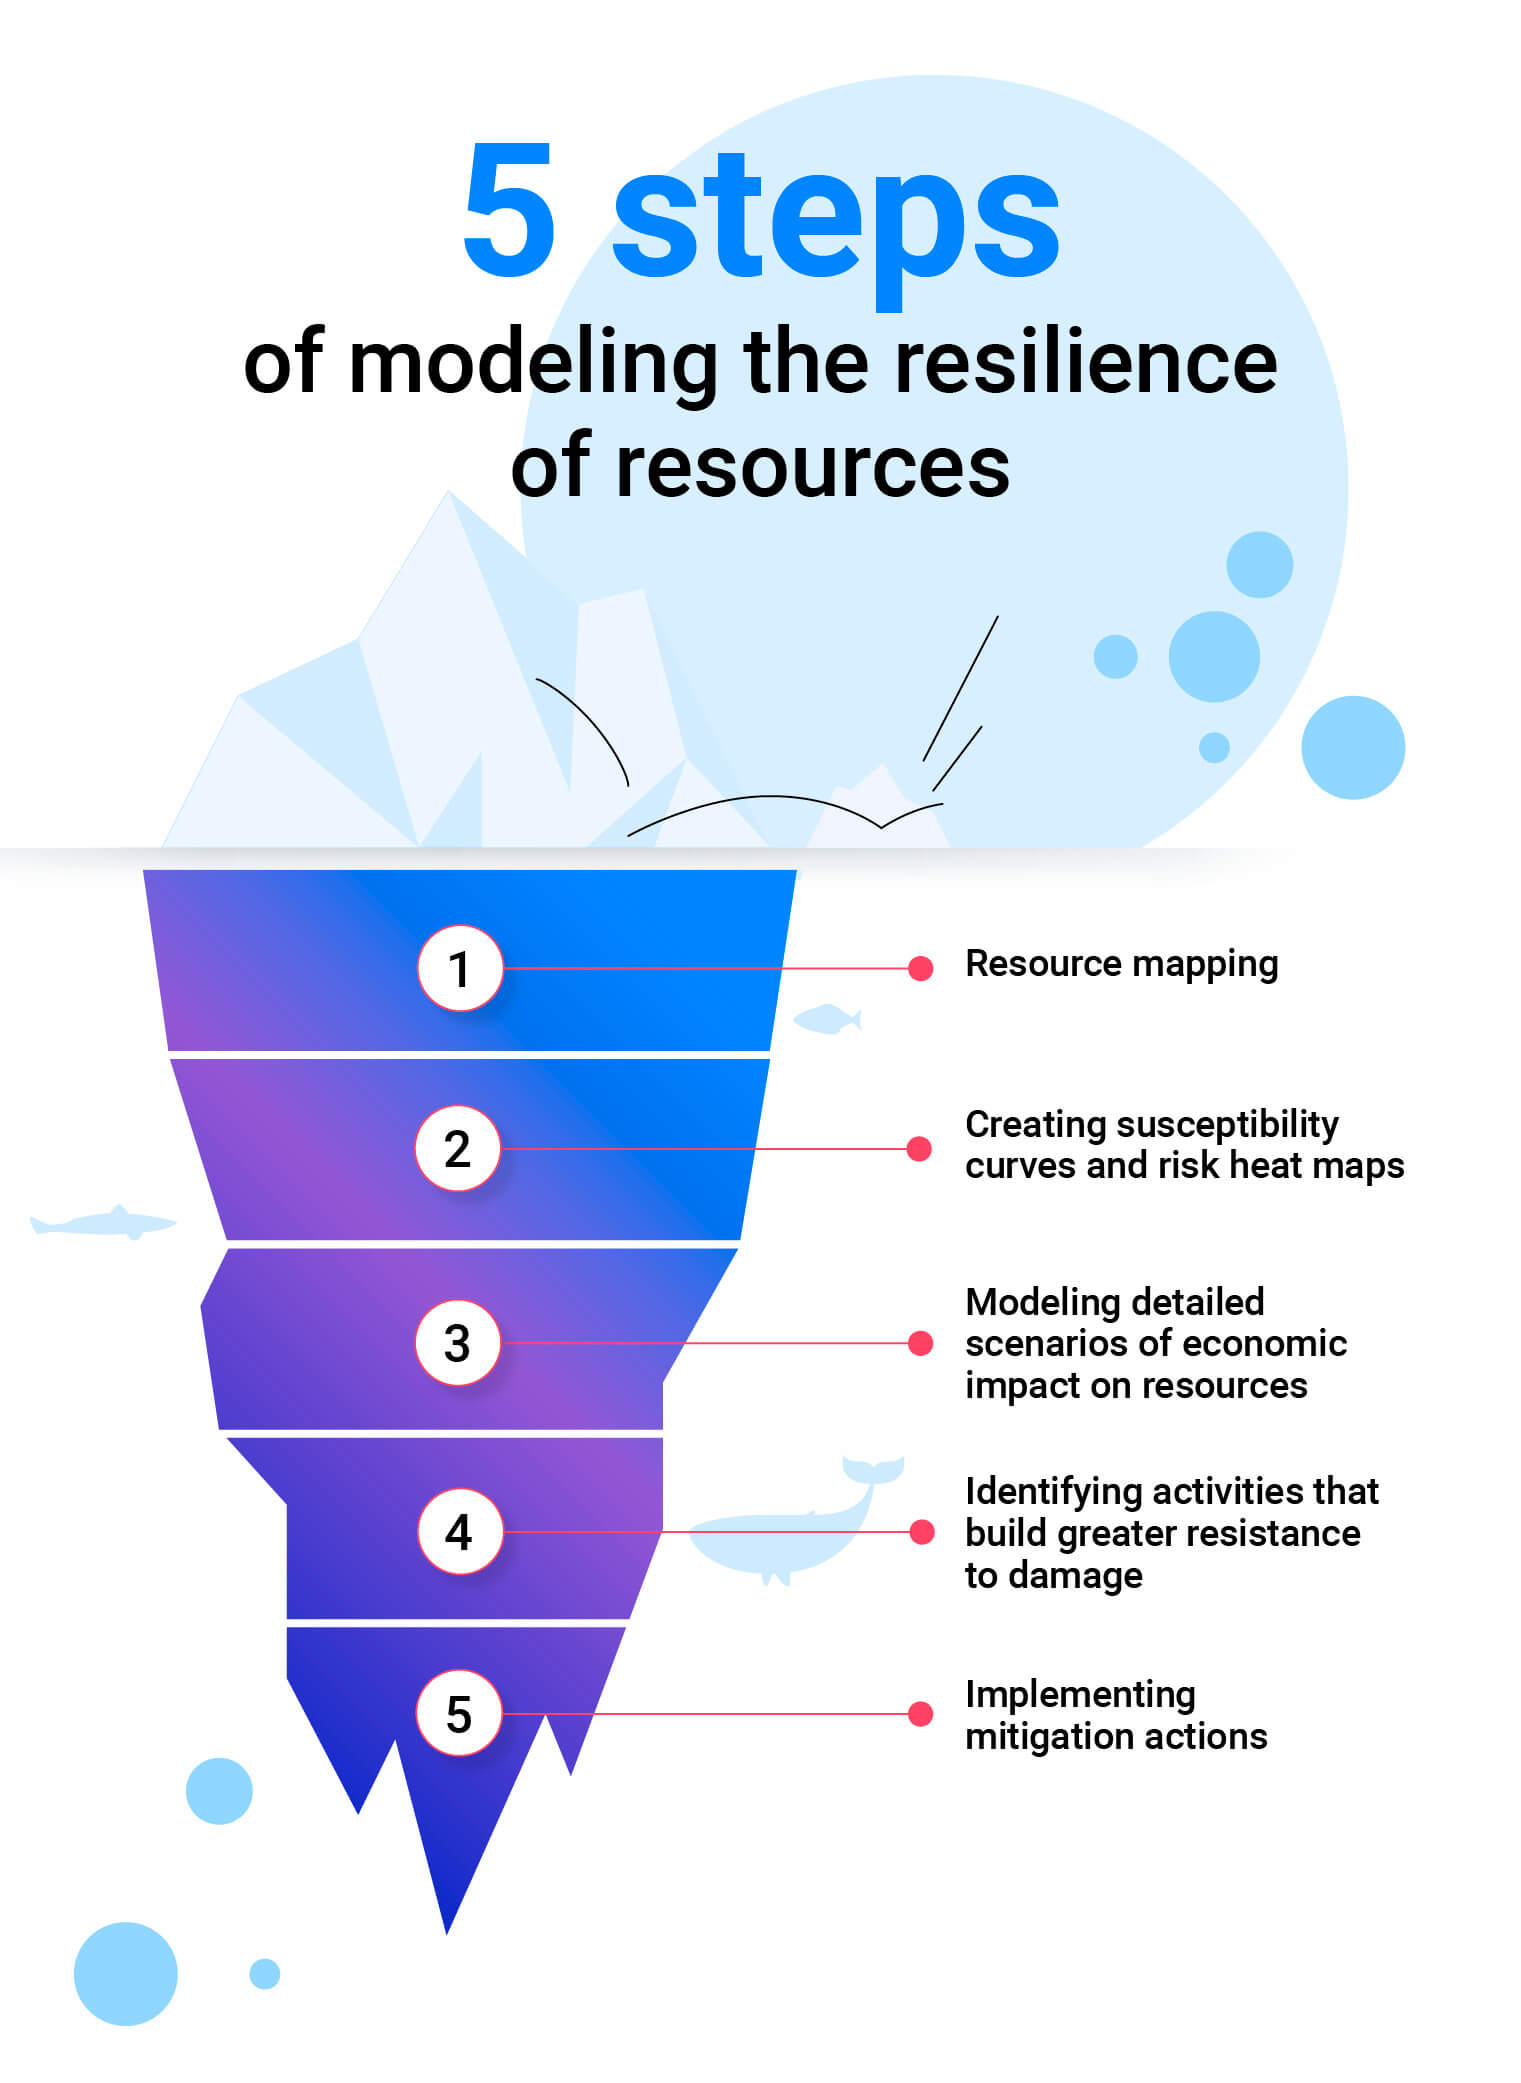
5 steps of modeling the resilience of resources:
- Resource mapping
- Creating susceptibility curves and risk heat maps
- Modeling detailed scenarios of economic impact on resources
- Identifying activities that build greater resistance to damage
- Implementing mitigation actions
It's high time to discuss the details.
1. Map resources

Knowing where there is a high risk of serious damage, we can prioritize chosen areas in the context of underwriting, pricing, or service in case of an event. It is necessary to visualize such risk areas by preparing the so-called heat maps. It will also be particularly helpful in making important business decisions and in further risk modeling. But what is the procedure?
First, map the resources; for insurers this means properties and their locations. Next, put the geographical areas of extreme weather events on the map. Various scenarios of serious events can be predicted, such as storms, fires, or floods caused by rainfall. The weather and climate forecasts for a specific area and period (e.g. for a given agglomeration in the years 2022-2032) may then be further examined in order to assess the likelihood of a specific event occurring.
Laying the groundwork in this way will be crucial for the next steps.
2. Create susceptibility curves and risk heat maps
Having prioritized the areas affected by severe weather, you can now identify and classify direct and indirect cases of resource vulnerability and their interactions. For example, in the case of extreme storms, direct effects include strong winds on the insured property, while indirect effects include more frequent overvoltages resulting from current disruptions. By measuring the intensity of a weather event and comparing it with the probability of its occurrence, a susceptibility curve can be created.
This information can then be applied to previously prepared heat maps in order to visualize the probability of extreme damage. To make the job easier, it is best to divide the geographical area into smaller sections. In the first iteration, it will be necessary to come to terms with numerous simplifications, e.g. the failure to take into account the ratio of wooden buildings to brick buildings in a given area. Ultimately, this step should help identify areas most prone to extreme damage.
3. Model detailed scenarios of the economic impact on resources

Once the geographical areas and their propensity for injury have been identified, assess the potential extent of the injury, especially in terms of the impact on the liquidity and profitability of the company. These resource impact scenarios can be tested and updated using advanced analytical simulation methods.
In this way, areas with the greatest need for mitigation can be identified. For example, we can expect certain economic consequences based on the expected number of events in a given intensity scale over a certain period of time in a specific area.
4. Identify actions that build greater resilience to damage

At this stage, it is necessary to build a task plan to mitigate the future effects of insurance events. Such a schedule can be created based on the availability of resources (primarily, the budget) and within the framework of applicable law. A natural consequence of this step may be, for example, the need to start discussions with legislative bodies about cases for which there are not yet adequate provisions to mitigate climate change.
The summary of the lists of necessary actions shows the areas with the greatest need for mitigation. For example, if a given area has a high probability of being badly damaged – a risk additionally intensified by the high share of wooden buildings – some extra mitigating measures can be: an increase in the insurance premium, mandatory lustration, an administrative decision to tighten the conditions for the construction of wooden buildings.
Such advanced analytics allow further optimization of costs and benefits, or more effective prediction of weather events and their effects.
5. Implement the mitigation action plan

In this step, implement the action strategy discussed and adapted to the law. In order for it to be effective, each task in the plan should be linked to asset management models in the enterprise; this will increase the effectiveness of all arranged activities. In addition, it is good when the tasks are part of a comprehensive change management strategy in the organization, including planning, budgeting, and asset management.
Why is this strategy worth the effort?
As the correlation between insurance and climate change grows, a systemic approach to the problem facilitates a more accurate estimation of future events and their impact on the company's results. It helps to limit the maintenance of inefficient budgetary reserves, often in favor of more satisfactory reinsurance contracts. It is also useful for evaluating risk more accurately, planning underwriting requirements, or starting discussions with legislative bodies. The benefits are aplenty.
In order for the application of the climate change resilience model to be possible at all, it is necessary to collect quality data. This is determined by the innovativeness of the insurer's software, manifested in the possibilities of aggregation and integration of data, as well as the degree of their transparency and availability.
In the Comarch Digital Insurance (CDI) system, we used many practical solutions aimed at achieving excellence in collecting and presenting data. In addition, the possibility to extend CDI with an artificial intelligence module means that data processing becomes largely automated.
We invite you to contact us and get more information

Product Marketing Manager – Comarch Digital Insurance